--- title: "SDG Localisation Dashboard for Government of Jammu & Kashmir" url: https://www.velsof.com/case-studies/sdg-localisation-dashboard-for-government-of-jammu-kashmir/ date: 2026-02-23 type: case_study author: Velocity Software Solutions client: "United Nations Development Programme (UNDP) India / Government of Jammu & Kashmir" industry: Sustainable Development / Data Analytics / e-Governance location: "Jammu/Srinagar, Jammu & Kashmir, India" categories: Case Studies tags: Cybersecurity, Dashboard, Monitoring, Reporting, Training, UNDP, Web Application Development --- ## The Challenge The Union Territory of Jammu & Kashmir, operating within India’s federal SDG monitoring framework, faced unique challenges in tracking and accelerating progress toward the 2030 Agenda: - **Dual-Capital Administration**: Government operations alternate between Jammu and Srinagar depending on the season, creating complex coordination requirements for any digital monitoring system. - **Absence of Digital SDG Infrastructure**: Despite having drafted its State Indicator Framework (SIF) and District Indicator Framework (DIF) in alignment with MoSPI’s national indicators, J&K lacked a digital platform to operationalize these frameworks. - **State-District Monitoring Gap**: Progress needed to be tracked at both the UT level and across all districts, requiring a data architecture capable of handling hierarchical aggregation with appropriate administrative boundaries. - **Limited Policy Visibility**: Departments, administrative secretaries, policymakers, external partners, and citizens had no unified mechanism to assess SDG progress against indicators, targets, and goals for 2030. - **NITI Aayog Reporting Requirements**: J&K needed a systematic mechanism to report SDG progress to NITI Aayog, requiring alignment with the national SDG India Index methodology and indicator frameworks. - **Data Collection Infrastructure Gap**: Government departments and state officials lacked structured tools for systematic SDG data input at state and district levels. UNDP India, which was partnering with various state governments to effectively localize SDGs, solicited a service provider to design, develop, and manage the SDG Dashboard for the UT of Jammu & Kashmir. ## Velocity’s Solution ### Scope of Work Velocity designed, developed, and deployed an interactive SDG Localisation Dashboard (Web) for the Government of Jammu & Kashmir, providing comprehensive UT and district-level SDG monitoring with data entry, visualization, analytics, and reporting capabilities aligned with national frameworks. ### Key Features & Deliverables 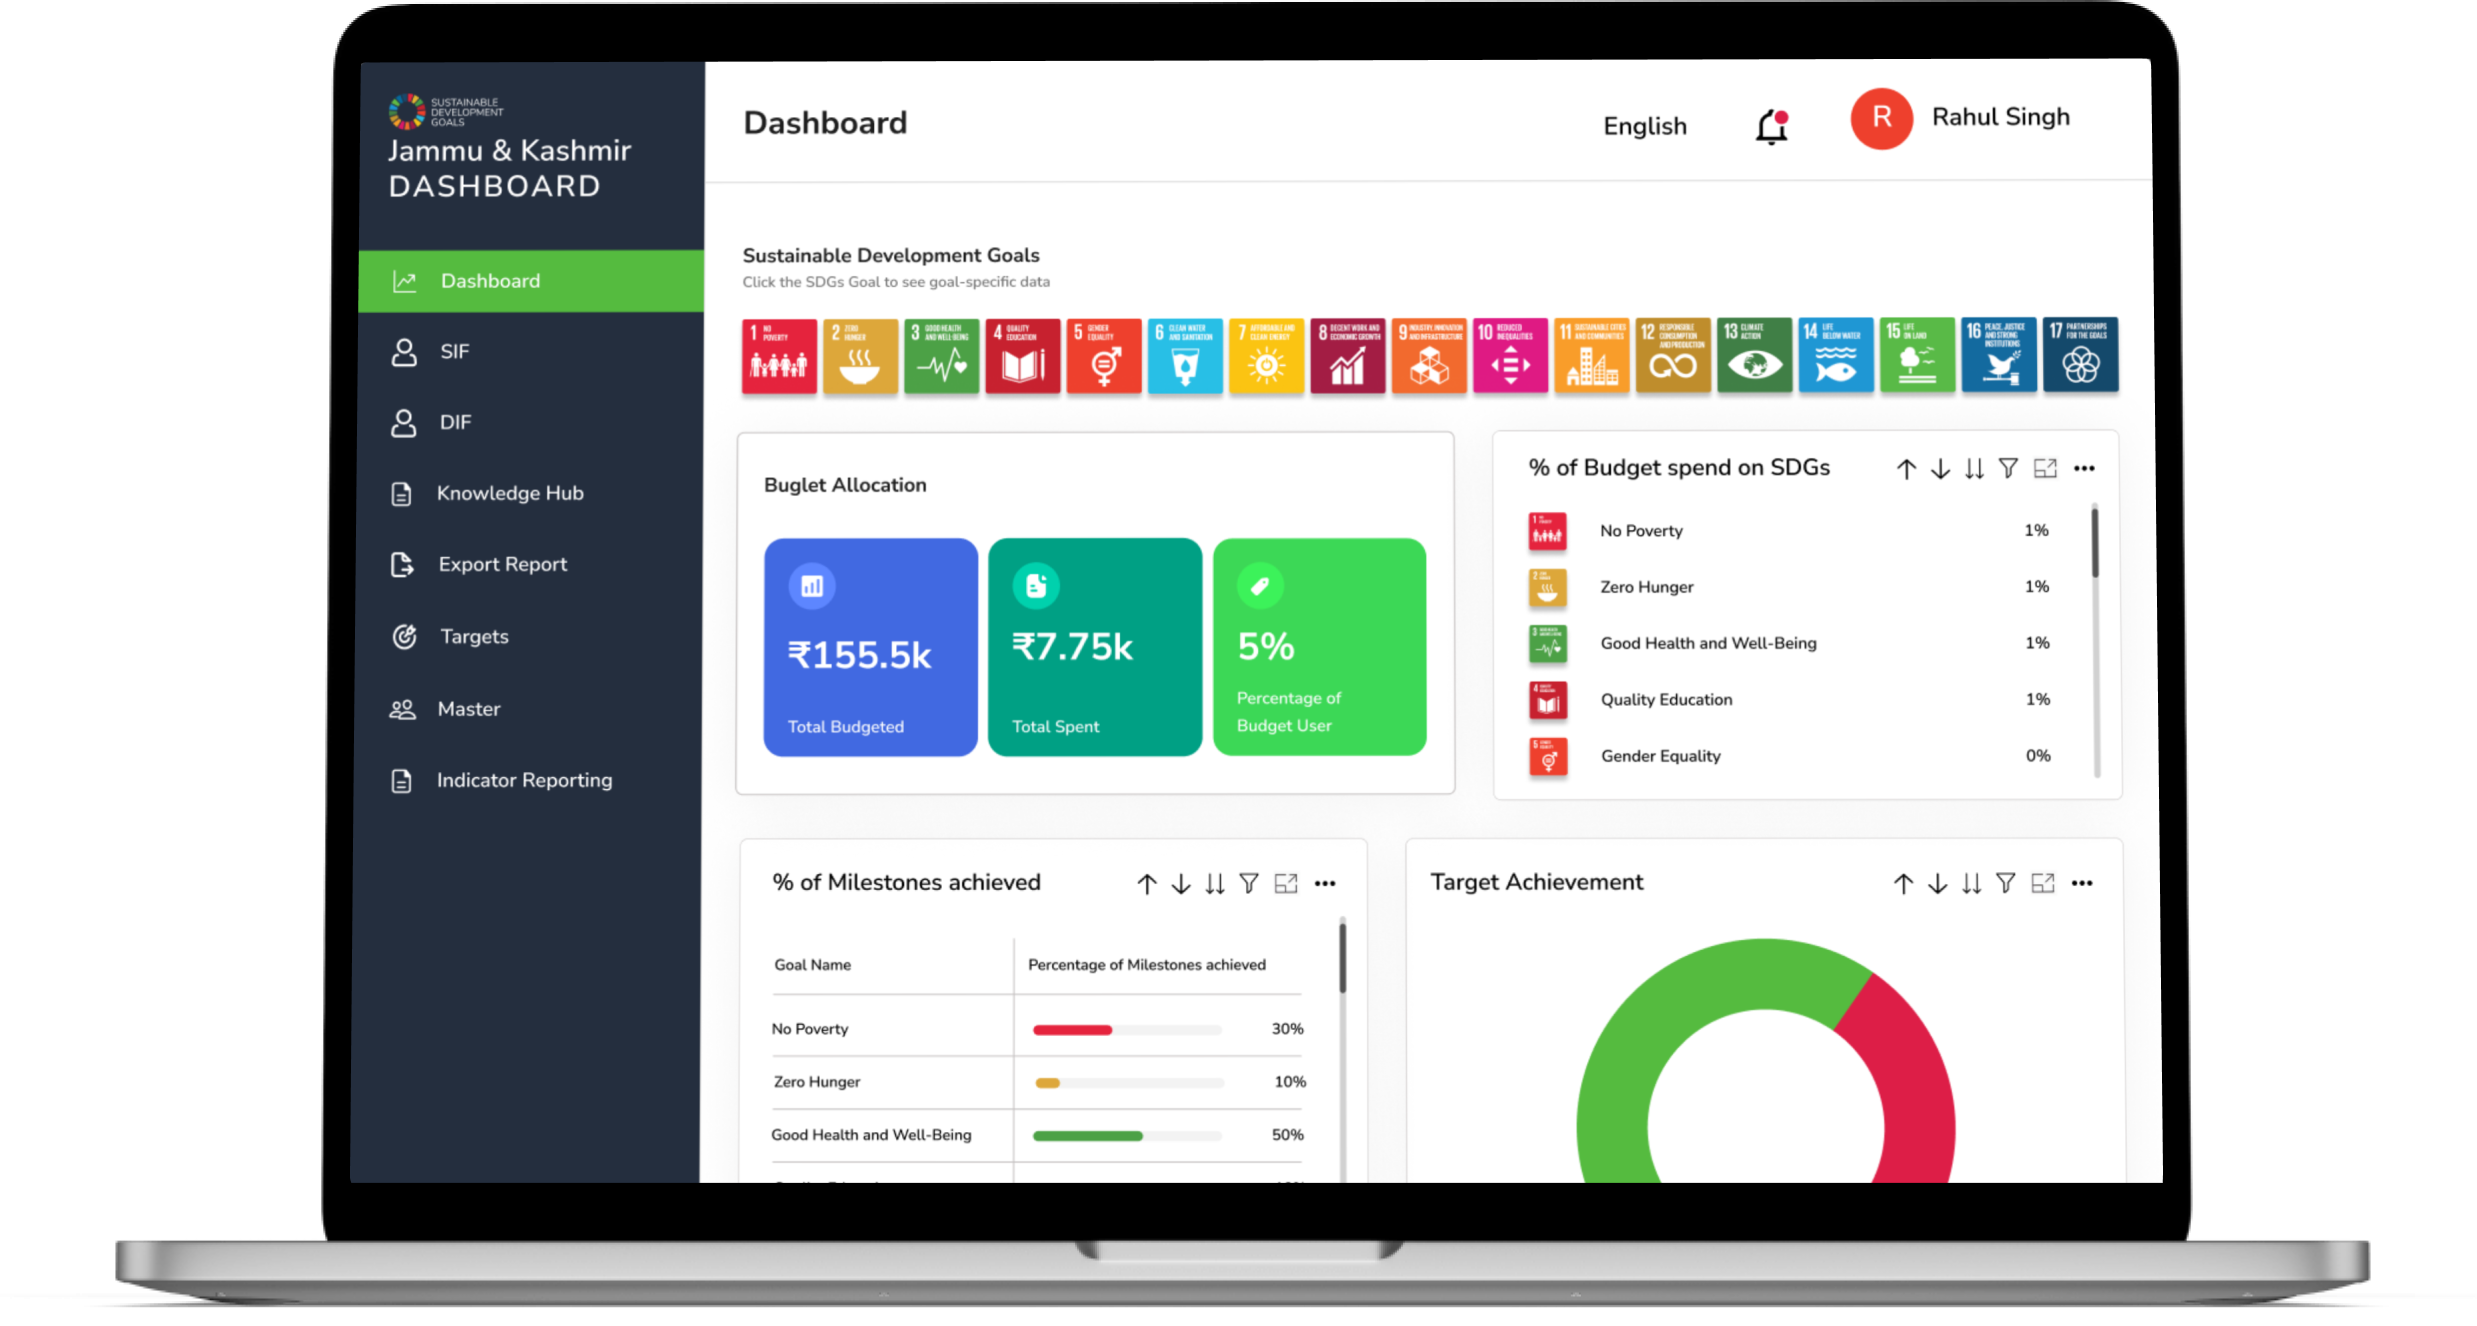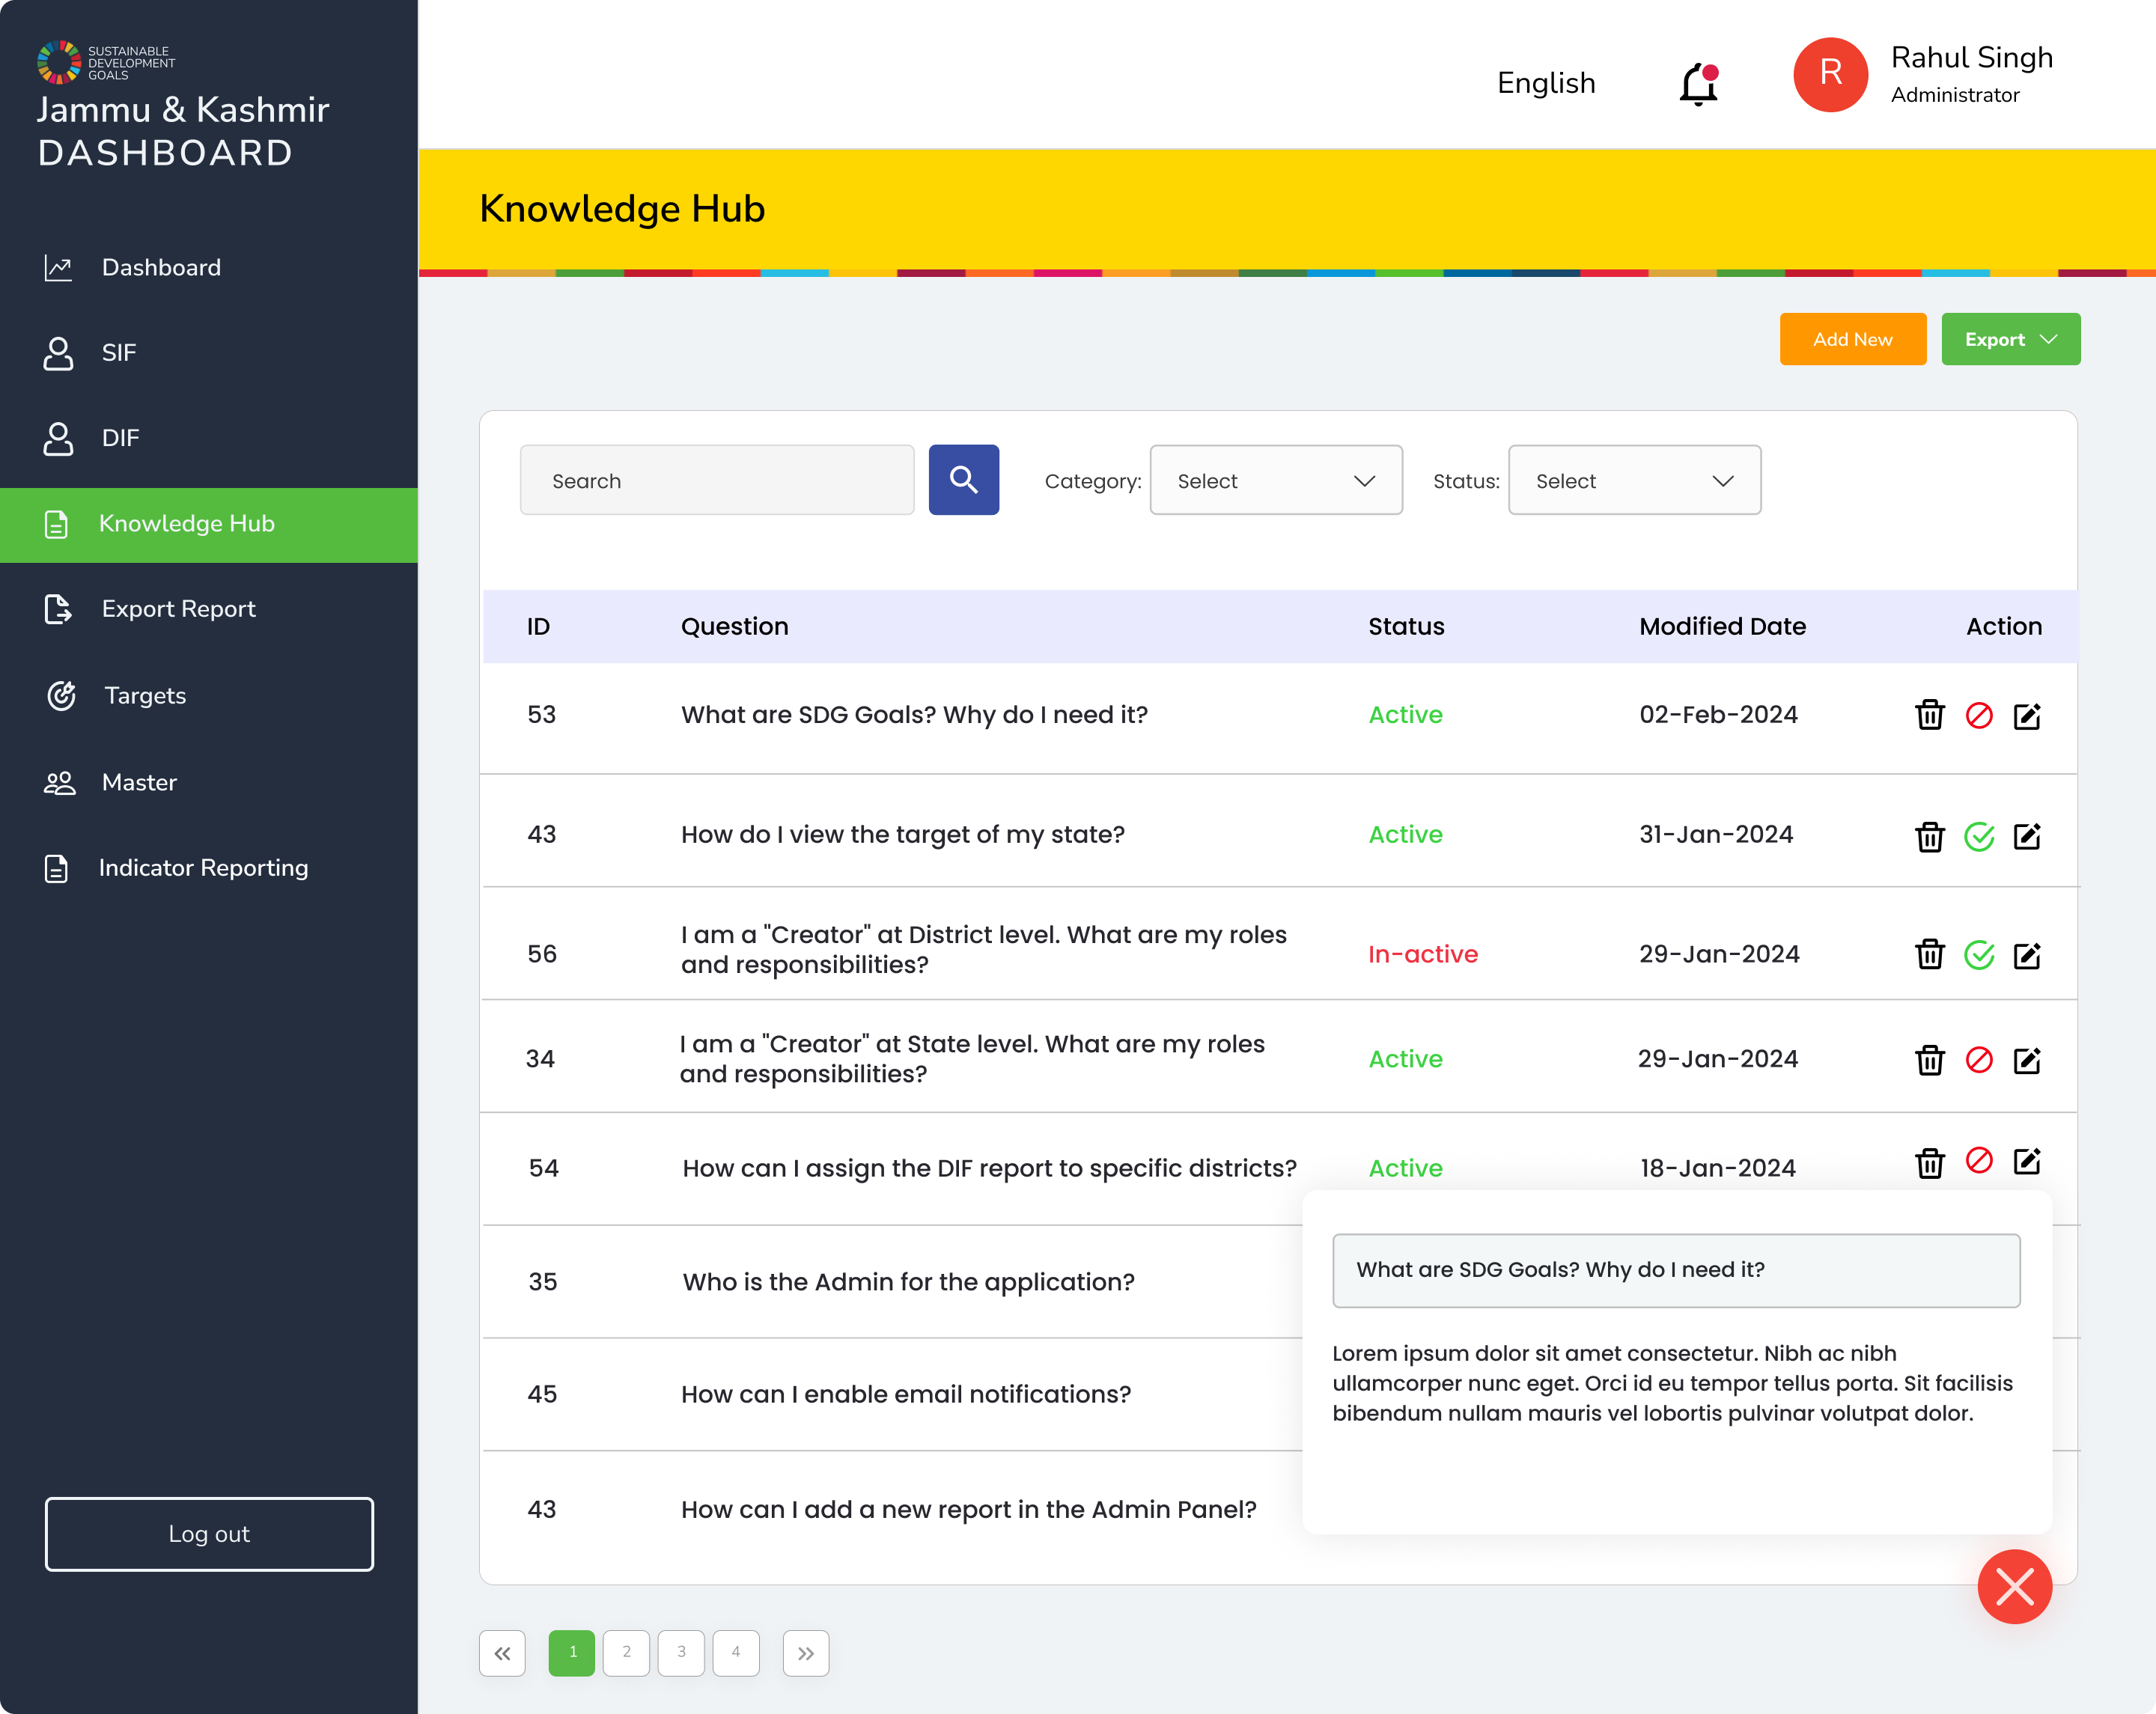 **Interactive SDG Dashboard** – Comprehensive web-based dashboard monitoring all 17 SDGs at UT and district levels – Progress tracking against SIF and DIF indicators, targets, and goals – Interactive data visualizations with charts, graphs, and geospatial maps – Goal-wise, target-wise, and indicator-wise drill-down capabilities – Comparative analysis between districts with ranking mechanisms – Time-series progress tracking and trend analysis – Responsive web design for cross-device accessibility **Data Entry & Management** – Structured data input tool for departmental and state official use – Multi-level data entry capabilities (UT and district levels) – Bulk upload functionality via standardized templates – Data validation rules and quality assurance checks – Role-based access control for data contributors and administrators **Analytics & Integration** – SDG progress scoring aligned with NITI Aayog’s national methodology – Custom report generation and data extraction – Open APIs for integration with national SDG dashboard and external applications – Data download capabilities for research and policy analysis – Dashboard widget development for flexible data presentation **Technical Deliverables** – System Requirement Specification (SRS) – Design document with code structure and architecture – Database architecture with Entity-Relationship diagrams – Data Flow Diagrams for all system processes – System Manual (technical document updated per version) – User Manual (updated per version with pictorial guides) – Security audit report from empaneled agency – Application installation guide with pictorial instructions and infrastructure recommendations – Working copy of source code (latest version) – Complete documentation of external dependencies – Open API documentation for all integration points **Capacity Building** – Training of DES (Directorate of Economics and Statistics) and district admin staff on data management, updates, and dashboard maintenance – Capacity building of department/state officials on data input tool usage – Technical training and support for software operationalization – Development of additional widgets as per evolving requirements **Continuous Maintenance** – One year of continuous maintenance and bug resolution – Hosting until deployment on NIC/government server – Small customizations and feature additions – Performance optimization and technical support ### Technology Stack - **Web Application**: Open-source technologies with [responsive design](https://www.velsof.com/web-development/) - **Frontend**: Interactive UI with advanced data visualization libraries and geospatial mapping - **Backend**: Open-source framework with RESTful API architecture - **Database**: Open-source RDBMS with hierarchical data management capabilities - **APIs**: External application integration (NITI Aayog national SDG dashboard) - **Security**: Third-party security audit compliance per government standards - **Hosting**: Vendor hosting during development with migration to NIC/government server ## Implementation Approach The project followed a four-phase delivery model over 12 months: 1. **Phase I – Foundation (30%)**: Core SDG Dashboard with UT-level and district-level indicator framework, primary data entry functionality, and base visualizations. System architecture design and SRS documentation. 2. **Phase II – Development (30%)**: Full dashboard development with advanced analytics, comparative district analysis, comprehensive data input tools, and API integration capabilities. 3. **Phase III – Deployment & Testing (30%)**: User acceptance testing, security audit, performance optimization, production deployment, and comprehensive documentation delivery. 4. **Phase IV – Post-Deployment Operations (10%)**: Continuous maintenance and bug fixing, hosting services, small customizations, and technical training/support on a needs basis. The project team comprised: – **Team Leader**: Post-Graduate/Graduate in IT/Administration/Computer Science with 7+ years in IT system development and management, handling 4+ implementation projects with strong development sector knowledge. – **Product/Project Management Expert**: Post-Graduate/Graduate in IT with 5+ years in IT system development, working experience as business analyst, designer, full-stack developer, and data visualizer. – **[Software Development](https://www.velsof.com/software-development/)/Product Management Expert**: Post-Graduate/Graduate in IT with 4+ years in dashboard development, [mobile application development](https://www.velsof.com/mobile-app-development/), and MIS implementation. The implementation required at least two on-site visits to Jammu or Srinagar for stakeholder discussions, with travel coordinated based on where administrative secretaries were operating at that time. ## Key Outcomes & Impact - **UT-Level SDG Monitoring**: Established J&K’s first comprehensive digital SDG monitoring platform, enabling systematic tracking of all 17 goals at both UT and district levels. - **Aligned with National Framework**: Seamlessly integrated with NITI Aayog’s national SDG monitoring methodology, ensuring J&K’s data contributions are compatible with India’s global SDG reporting. - **Evidence-Based Governance**: Empowered J&K’s administrative secretaries and policymakers with real-time, data-driven insights into development progress, enabling targeted course corrections and resource allocation. - **District-Level Comparative Analysis**: Provided district administrators with benchmarking tools to identify lagging areas and prioritize interventions, fostering healthy competition among districts. - **Transparent Development Tracking**: Public-facing dashboard enhanced transparency and accountability, enabling citizens, media, and external partners to independently monitor the UT’s development trajectory. - **Institutional Data Infrastructure**: Established a sustainable data collection and management infrastructure through standardized input tools and trained government personnel. - **NITI Aayog Reporting Readiness**: Created a systematic reporting mechanism enabling J&K to efficiently contribute to national SDG assessments and index rankings. ## Why Velocity Velocity was selected through UNDP’s rigorous evaluation process (70% technical, 30% financial) based on: - **SDG Dashboard Portfolio**: Extensive portfolio of SDG-related dashboards developed for UNDP across multiple Indian states, providing a proven architecture and domain expertise directly transferable to the J&K context. - **End-to-End Technology Delivery**: Demonstrated capability in managing complete technology solution lifecycle from design through deployment and long-term maintenance for government and UN technology projects. - **Interactive Web Development Expertise**: Proven skills in creating responsive, interactive web pages with complex data visualization requirements, essential for the multi-indicator SDG dashboard. - **Government Data System Experience**: Track record in developing data-driven dashboards for state and central government institutions, including experience with NITI Aayog alignment requirements. - **Open-Source Technology Team**: Experienced team with minimum 3 years in open-source technologies across all required roles — business analysts, UI designers, frontend/backend developers, full-stack developers, and data visualizers. - **Quality-Focused Methodology**: Strong technical proposal demonstrating sound methodology, risk management, and quality assurance practices essential for a dashboard serving government decision-making. ### Related Services [AI & Automation](/ai-automation/)